Acquisition of financial assets and external financing in Germany in the fourth quarter of 2025 Results of the financial accounts by sector
- Household financial investment stable
- Real return up, but still negative for less wealthy households
- External financing of non-financial corporations down
Continued sharp rise in households’ financial assets
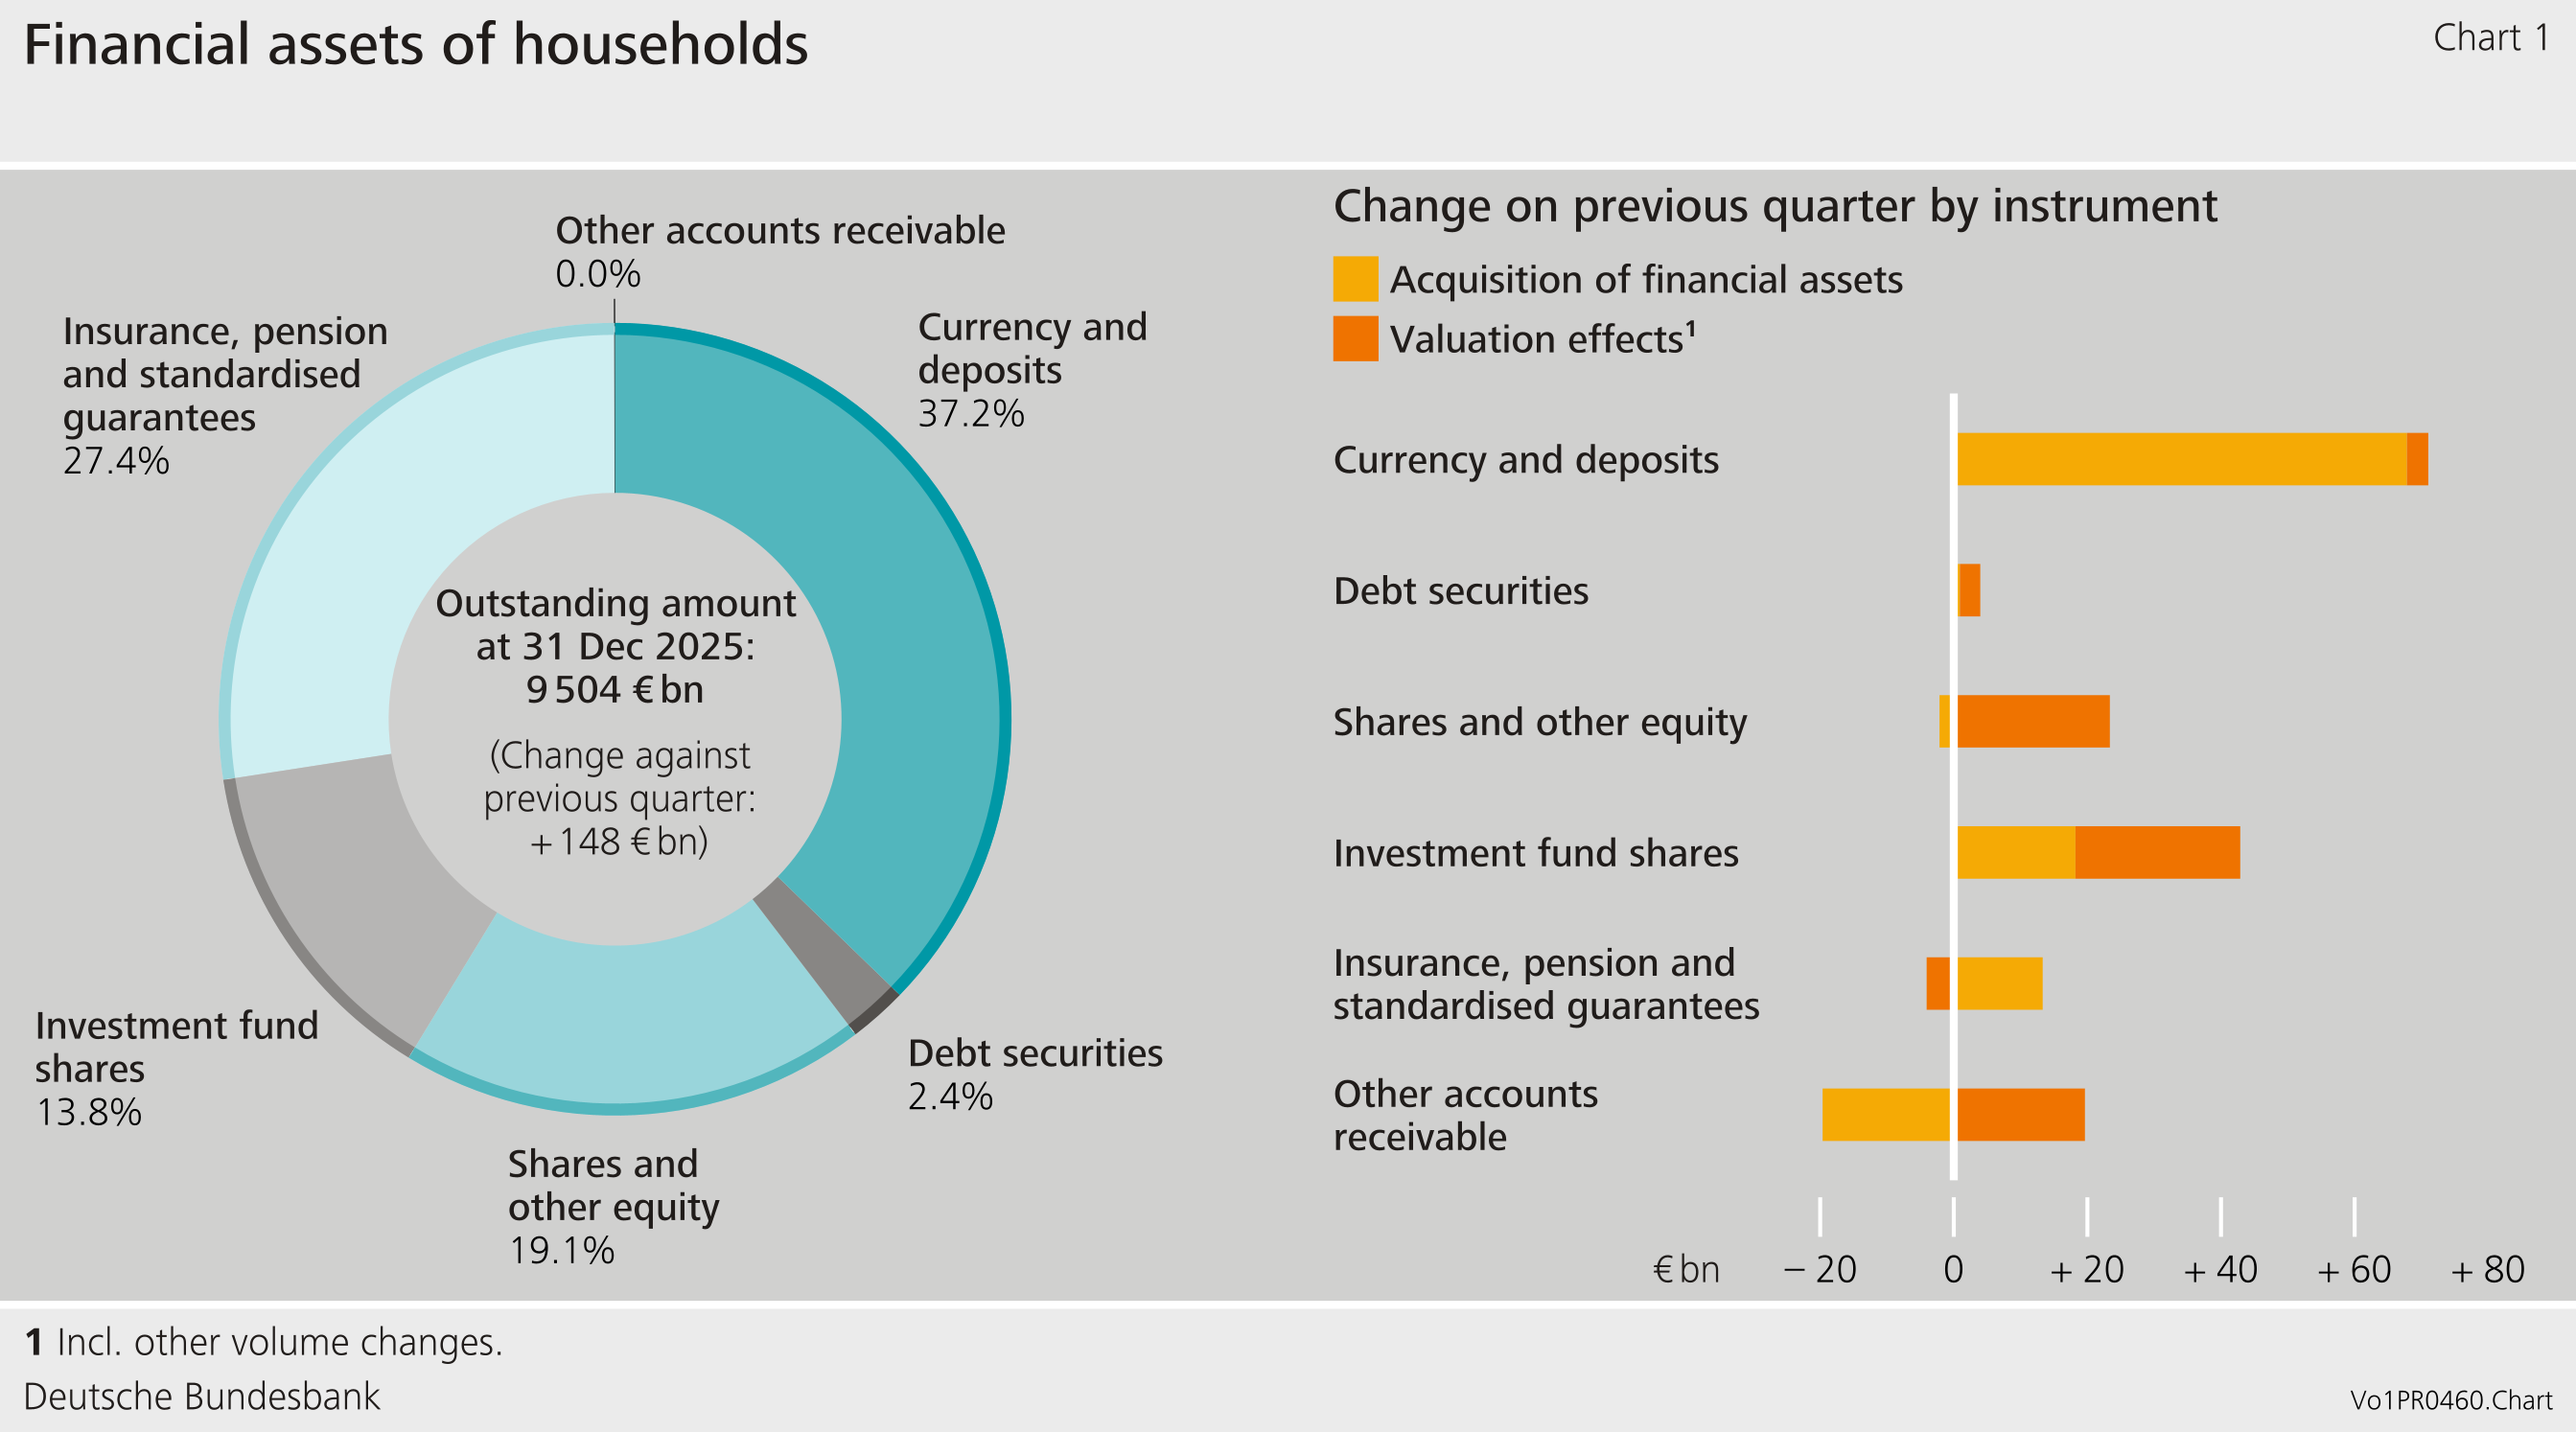
In the fourth quarter of 2025, households’ financial assets increased significantly, closing the year at €9,504 billion. This represents a rise of €148 billion on the previous quarter, with households building up their claims by €78 billion and generating valuation gains of €70 billion. Acquisition of financial assets was thus at a similar level to the previous quarter (€76 billion).
Households continued to display a strong preference for highly liquid assets: in the fourth quarter, they built up a substantial €63 billion worth of claims in the form of cash and sight deposits. Time deposits were accumulated in the amount of €8 billion, while savings deposits and savings bonds were reduced by €3 billion.
Although shares and other equity generated valuation gains of €23 billion, households sold them on balance: sales of listed shares issued by both residents and non-residents alike each amounted to €3 billion.
At €25 billion, valuation gains on investment fund shares were down significantly compared with the previous quarter (€41 billion), but still above the average of recent years. Net purchases amounted to €18 billion, which represents a slight decline on the quarter.
Debt securities showed little movement. In net terms they were purchased in the amount of €1 billion At the same time, they accounted for valuation gains of €3 billion. Insurance and pension claims were acquired on broadly the same scale as in the previous period (€13 billion, compared with €11 billion in the third quarter). Households recorded minor valuation losses of €4 billion on these.[1]
Real return on financial assets continues to rise
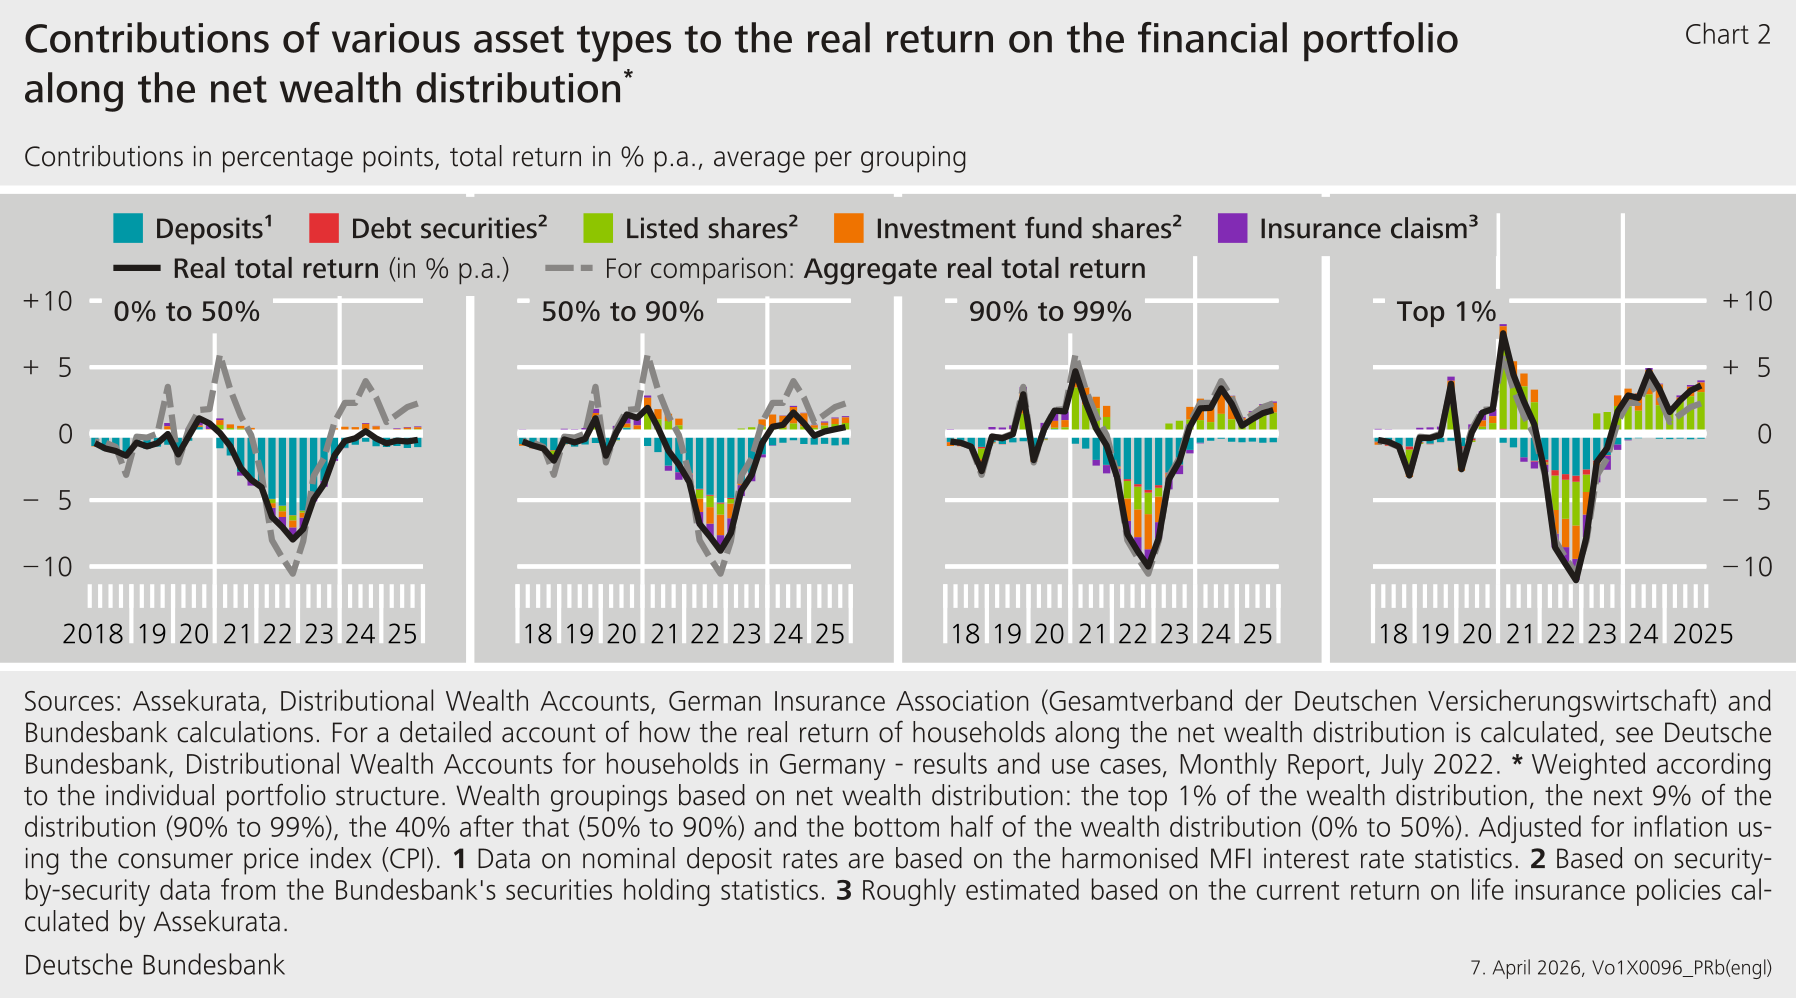
The real total return, i.e. the return adjusted for inflation, on financial assets represents the actual return on financial assets for households. Considering the individual structures of financial assets from the Distributional Wealth Accounts (DWA), Chart 2 shows the real total return on financial assets along the net wealth distribution.[2]
An analysis of wealth groups shows that the average real return achieved for households in the wealthier half of the distribution was positive and rose slightly overall in the fourth quarter.[3] By contrast, the less wealthy half of households continued to post a negative return. These households hold their financial assets almost exclusively as deposits and insurance claims, which, while low-risk, tend to yield lower returns. By contrast, the wealthiest 10 % of households benefited from positive contributions from capital market investments. This form of investment played a key role in boosting the real total return on their financial portfolio. Looking at all households together, the aggregate real total return on the year increased to around 2.3 % in the fourth quarter of 2025. This rise is attributable mainly to shares and investment fund shares. A negative real return on deposits once again had a dampening effect.
Real net financial assets increased at the end of 2025
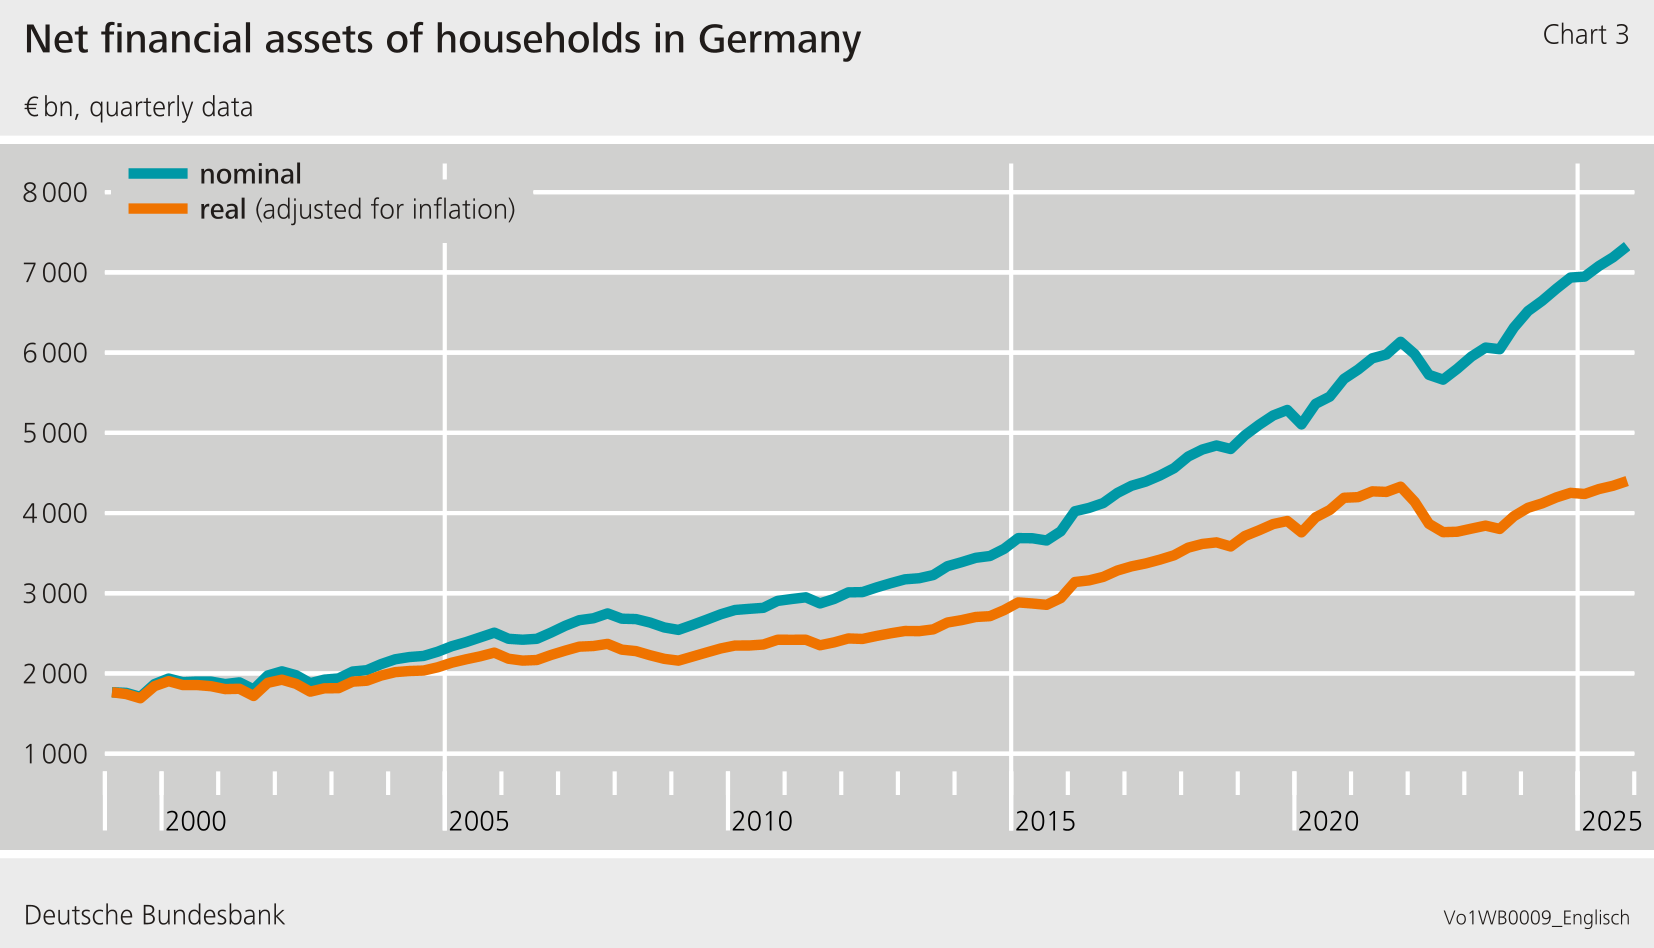
The purchasing power of nominal net financial assets fluctuates with the rate of inflation. For example, an inflation rate that exceeds the nominal growth in net financial assets leads to less goods and services potentially consumed on average, despite the net financial assets having increased nominally. To this extent, especially during periods of high inflation, it may make sense to also look at developments in financial assets in real terms. At the current end, calculated in 1999 prices, real net financial assets were significantly below the level from 2022 for several quarters. Inflation-induced losses in real net financial assets were only recouped over the course of 2025. Real net financial assets reached a new peak at the end of the year.
Households’ debt ratio down
Households’ liabilities grew to a total of €2,176 billion in the fourth quarter of 2025. Borrowing declined to €9 billion after having risen to €16 billion in the previous quarter.
Owing to the increase in nominal gross domestic product, the debt ratio fell to 48.7 %.[4]
Overall, net financial assets rose by €140 billion to €7,327 billion.
Decrease in external financing among non-financial corporations
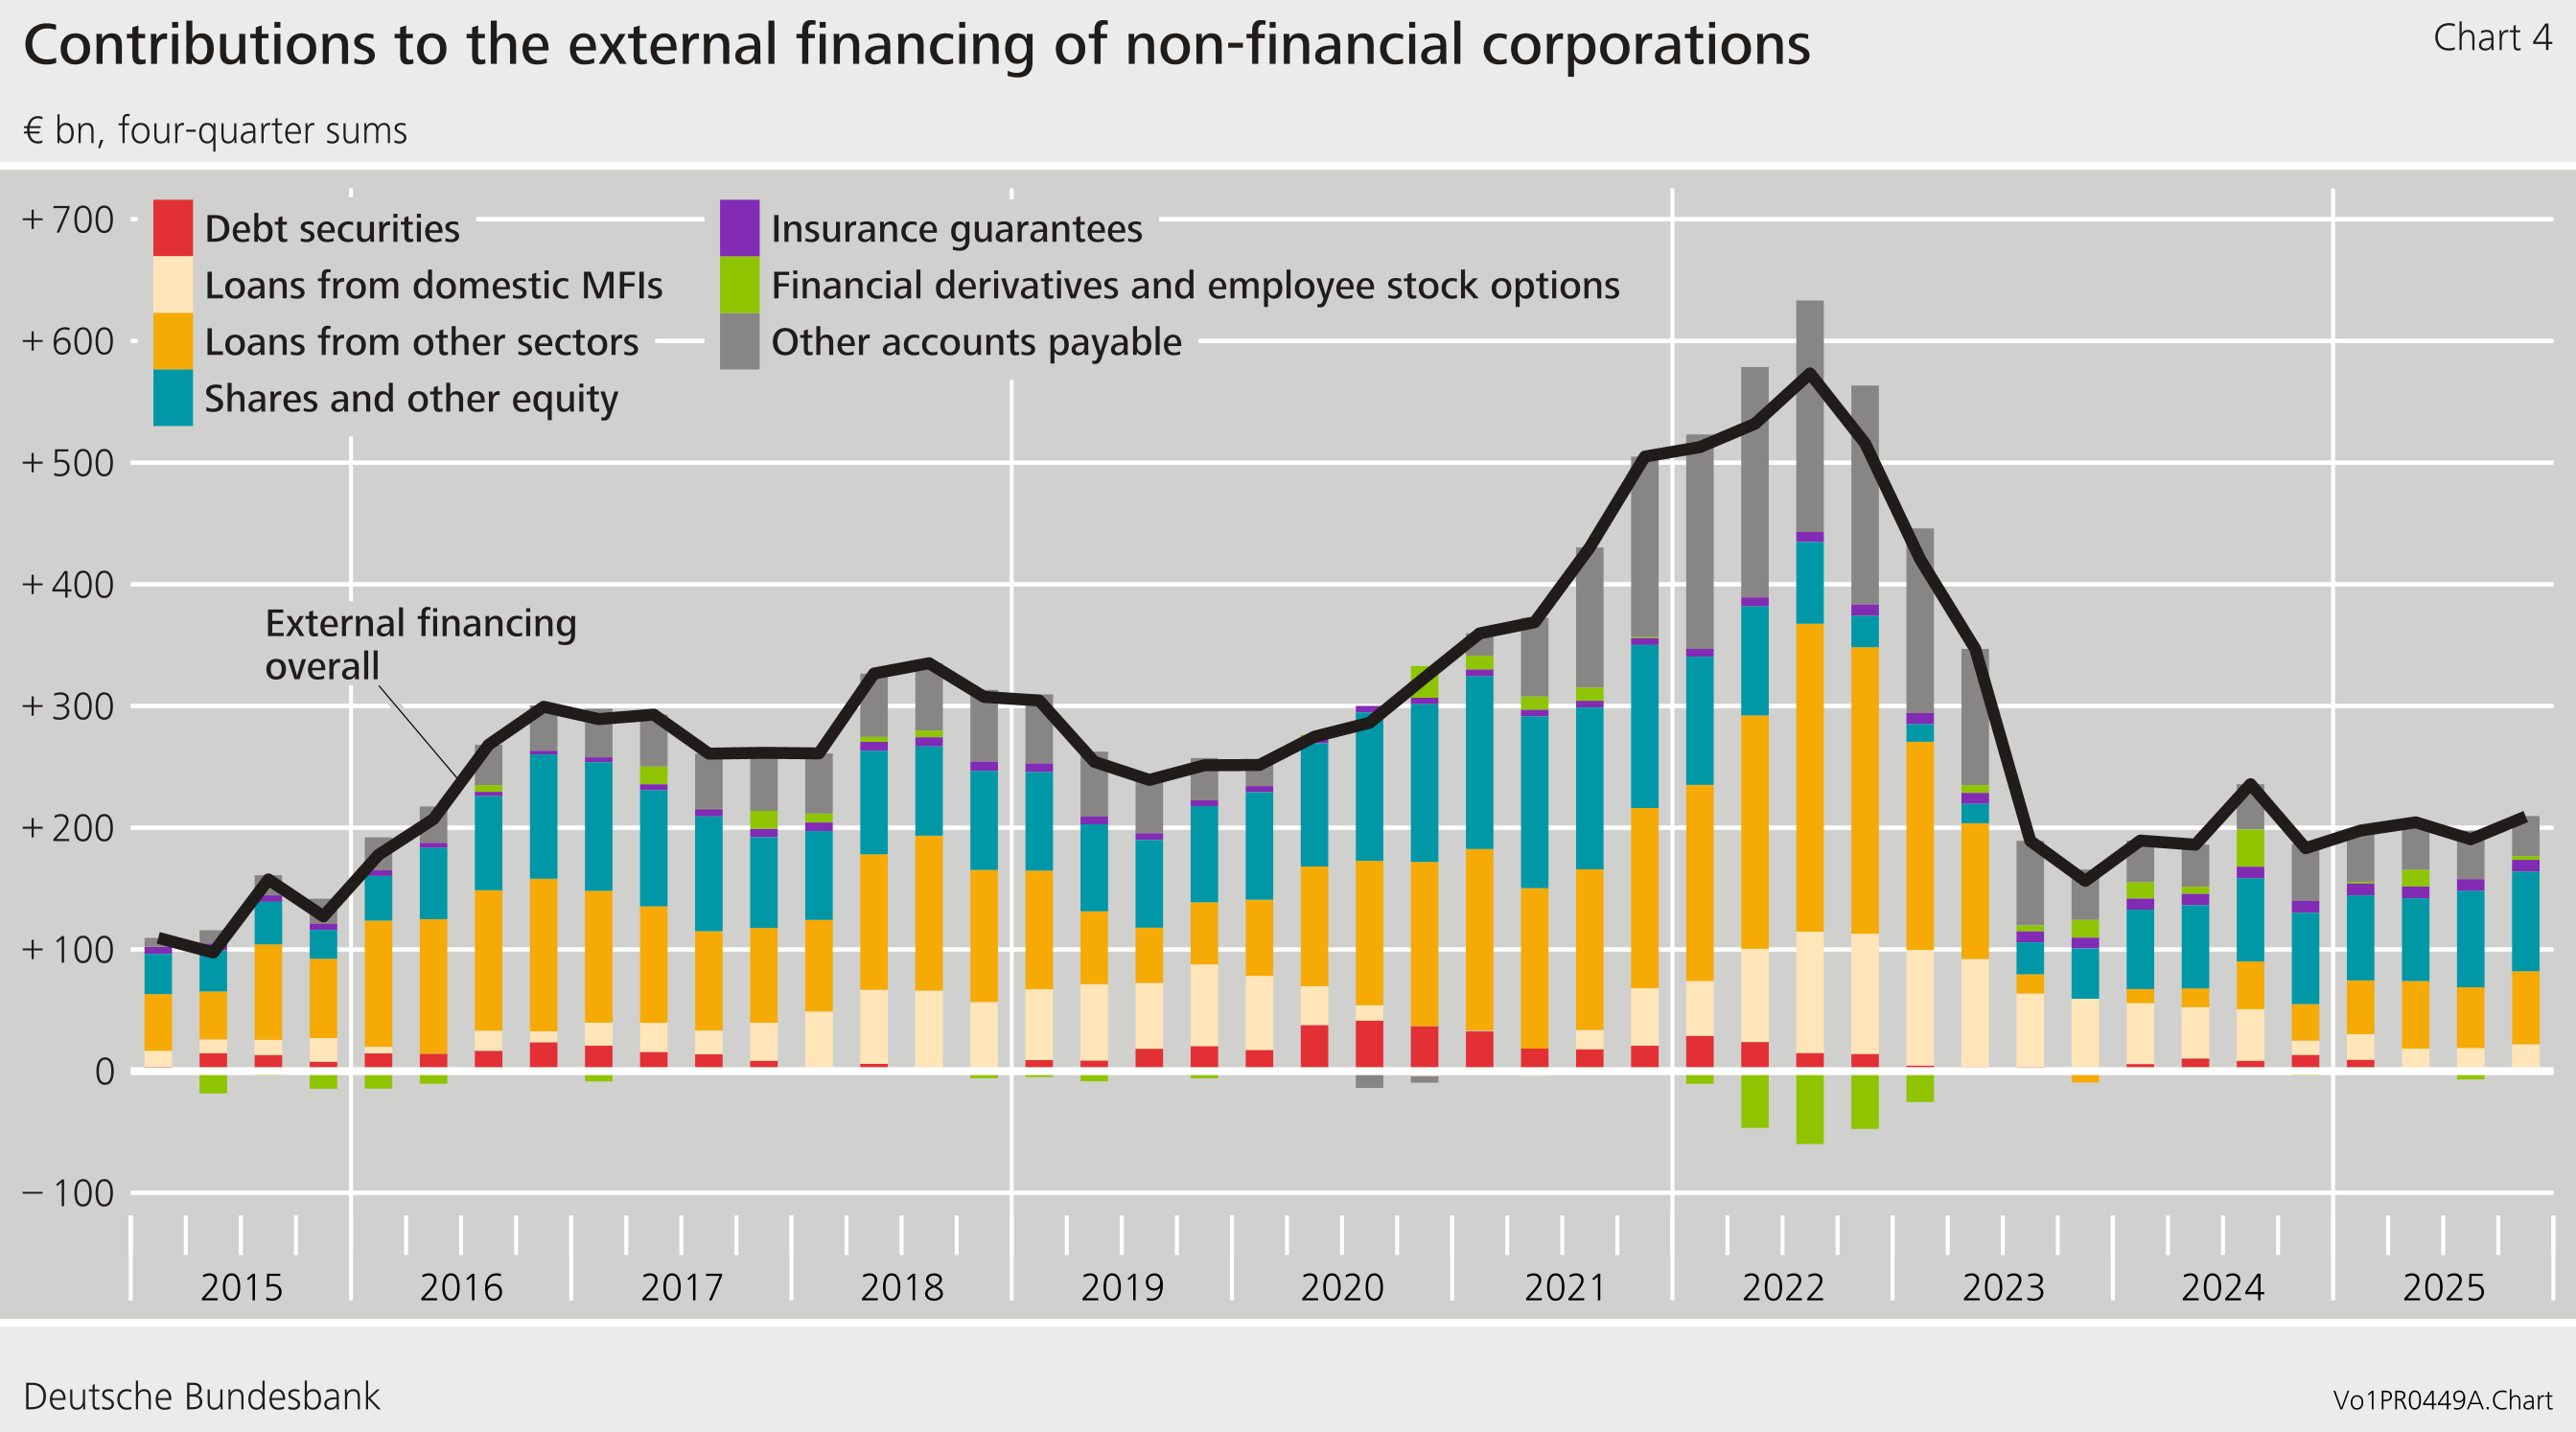
As in the previous year, non-financial corporations’ external financing fell in the fourth quarter of 2025. Compared with the previous quarter, it fell by €14 billion to €35 billion.
Among the components of external financing, new borrowing posted the largest decline. After €19 billion in the third quarter, it was close to zero in the fourth quarter of 2025. Loans from abroad, at − €20 billion, made a particularly large impact.
After repaying existing debt instruments on balance in the previous quarter, enterprises issued €2 billion worth of debt securities in the fourth quarter. Net issuance of shares and other equity amounted to €18 billion in the fourth quarter. It was thus €12 billion lower than in the previous quarter, but remained at a level comparable to the first two quarters of 2025. The difference compared with the previous quarter is mainly due to a decline in the issuance of listed shares in the fourth quarter.
Looking at the year as a whole, based on four-quarter moving sums, external financing continued to show little momentum. Overall, the sideways movement that has been observed over several quarters has largely continued.
At the end of the fourth quarter of 2025, non-financial corporations’ liabilities grew by €140 billion to €12,154 billion. Valuation effects amounting to €104 billion made a key contribution to this increase.
Despite this rise in enterprises’ liabilities, their debt ratio fell by one percentage point to 67.2 %, not least thanks to an increase in nominal gross domestic product.[5] The debt ratio, which measures debt against economic output, is an important indicator of enterprises’ financial stability.
The financial assets of non-financial corporations rose by €57 billion to €9,029 billion as at the end of the quarter under review. Net financial assets were unable to continue their growth from the previous quarter and fell by €82 billion to − €3,125 billion.
Owing to interim data revisions of the financial accounts and national accounts, the figures contained in this press release are not directly comparable with those shown in earlier press releases.
Footnotes:
- The method for calculating households’ technical provisions is based on the Solvency II reporting regime, under which the discounted cash flow method is used to calculate/value these provisions: https://eur-lex.europa.eu/legal-content/EN/TXT/PDF/?uri=CELEX:02009L0138–20190113. The relevant interest rate term structure for discounting technical provisions in Solvency II is determined by EIOPA on a monthly basis. At each valuation date, the provisions for all existing contracts must be valued at applicable interest rates. This form of marking to market means that, under Solvency II, technical provisions are significantly influenced by the current interest rate environment. This means valuation effects may be stronger in certain quarters.
- The Bundesbank uses the DWA to provide additional data on the distribution of household wealth. The DWA financial portfolio comprises the following asset types: deposits, debt securities, listed shares, investment fund shares and insurance claims (life insurance and private pensions). For more information on the DWA, see also https://www.bundesbank.de/en/statistics/macroeconomic-accounting-systems/balance-sheets/balance-sheets-792952#tar-2.Since the beginning of 2026, the latest results of the Bundesbank’s 2023 Household Survey have also been incorporated into the Distributional Wealth Accounts (DWA). Particularly at the current end, this is necessitating corresponding revisions to the DWA. The developments previously recorded are maintaining their trend trajectory. Nevertheless, net wealth in the upper middle of the wealth distribution has been revised upwards, while that for the less wealthy half has been revised downwards. The decline in average net wealth in the less wealthy half of the distribution is due, amongst other things, to an increase in outstanding amounts for mortgage loans that are not offset by correspondingly high real estate values. However, this does not necessarily imply increased borrowing by these households. Instead, declines in the valuation of real estate in 2023 may also have caused outstanding loans to exceed the current market value of the real estate. For more, see also Deutsche Bundesbank (2025), Household wealth and finances in Germany: Results of the 2023 household wealth survey, Monthly Report, April 2025.
- Specifically, the net wealth distribution is divided into four wealth groupings: the top 1 % of the distribution, the next 9 % of the distribution (90 % to 99 %), the following 40 % of the distribution (50 % to 90 %), and the less wealthy half of the distribution (0 % to 50 %). Net wealth is calculated as the difference between total assets (financial portfolio plus real estate and business assets) and liabilities (loans for house purchase and other debt).
- The debt ratio represents debt as a percentage of nominal gross domestic product (four-quarter moving sum).