
International trade in services
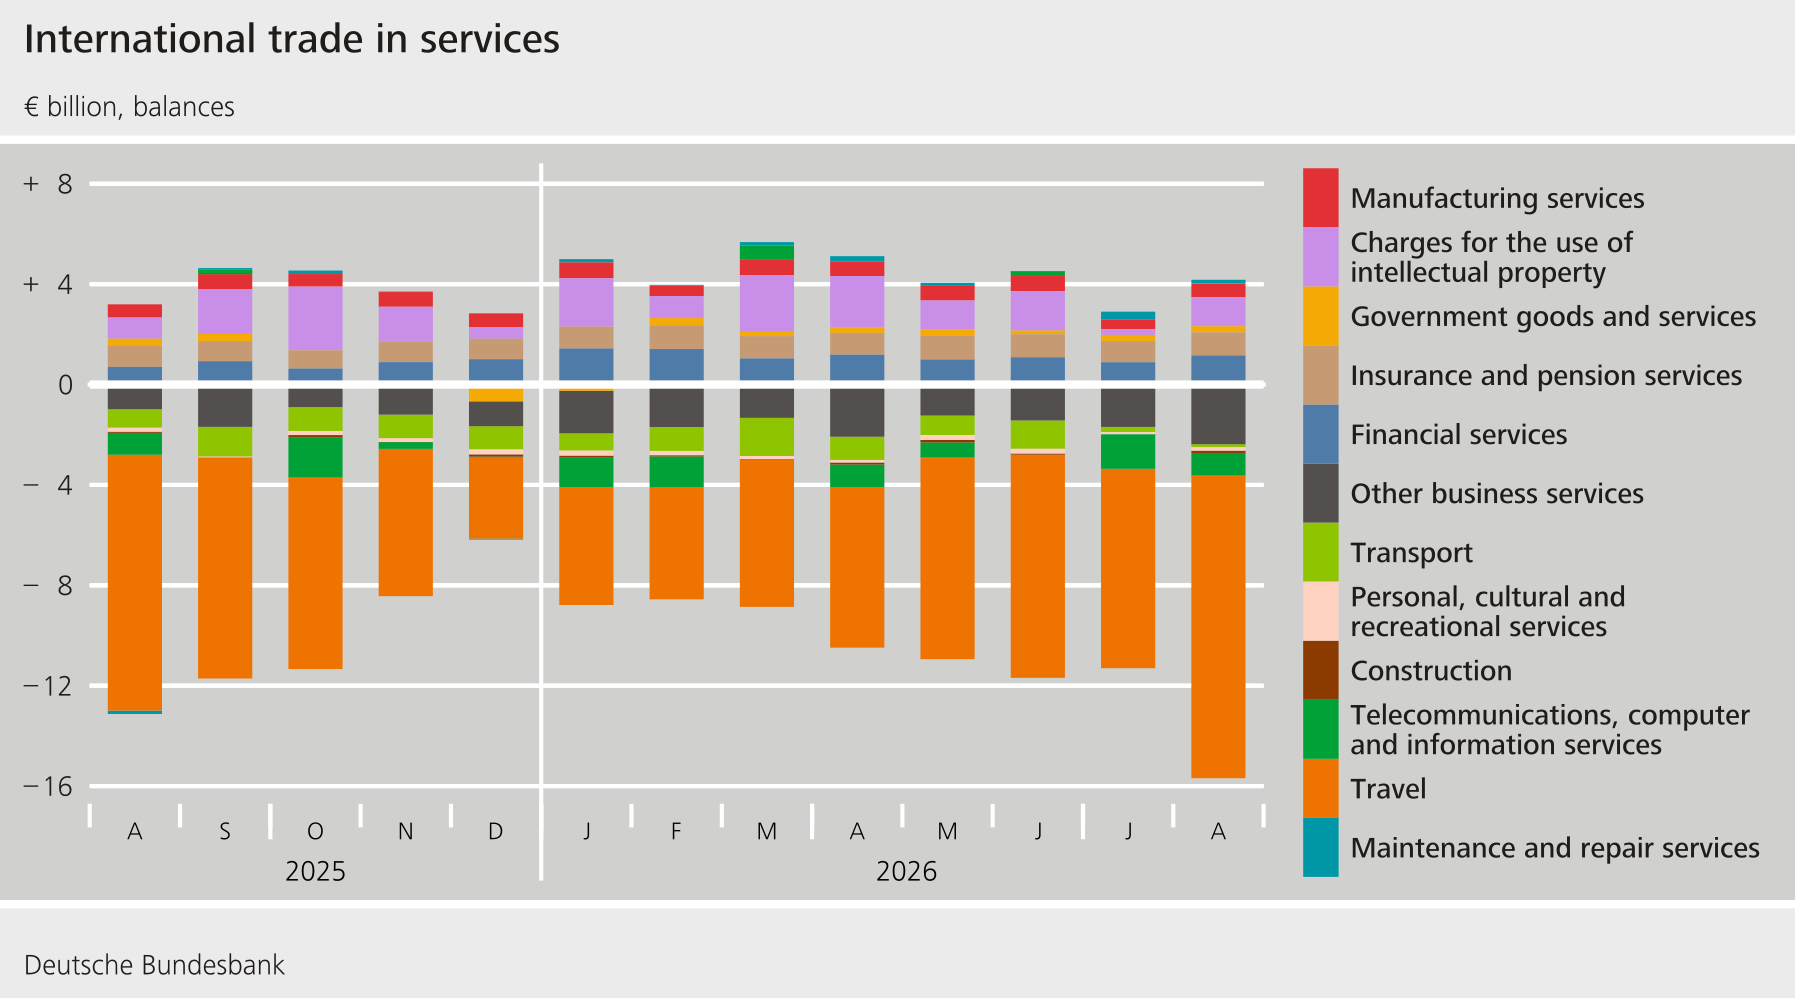
In August 2026, the services account deficit expanded by €3.1 billion on the month to €11.5 billion. Compared with the previous month, both revenue (€-4.9 billion) and expenditure (€-1.8 billion) fell.
Receipts from transport services (€-0.5 billion), travel (€-0.3 billion), charges for the use of intellectual property (€-0.9 billion), including research and development (€-0.8 billion), maintenance and repair services (€-0.3 billion) and other business services (€-2.4 billion), including research and development (€-0.9 billion) , of which professional services and management consultancy services (€-0.6 billion) and , of which technical services, commissions and other services (€-1 billion).
On the expenditure side, expenditure on travel increased (+ €3.8 billion). Expenditure on transport services (€-0.6 billion), charges for the use of intellectual property (€-1.8 billion), including research and development (€-0.4 billion), telecommunications, computer and information services (€-0.7 billion), including computer services (€-0.5 billion) and other business services (€-1.8 billion) decreased; Of which research and development (€-0.7 billion) and , of which freelancers and management consultancy services (€-0.6 billion) and , of which technical services, commissions and other services (€-0.5 billion).
Download
Technological services
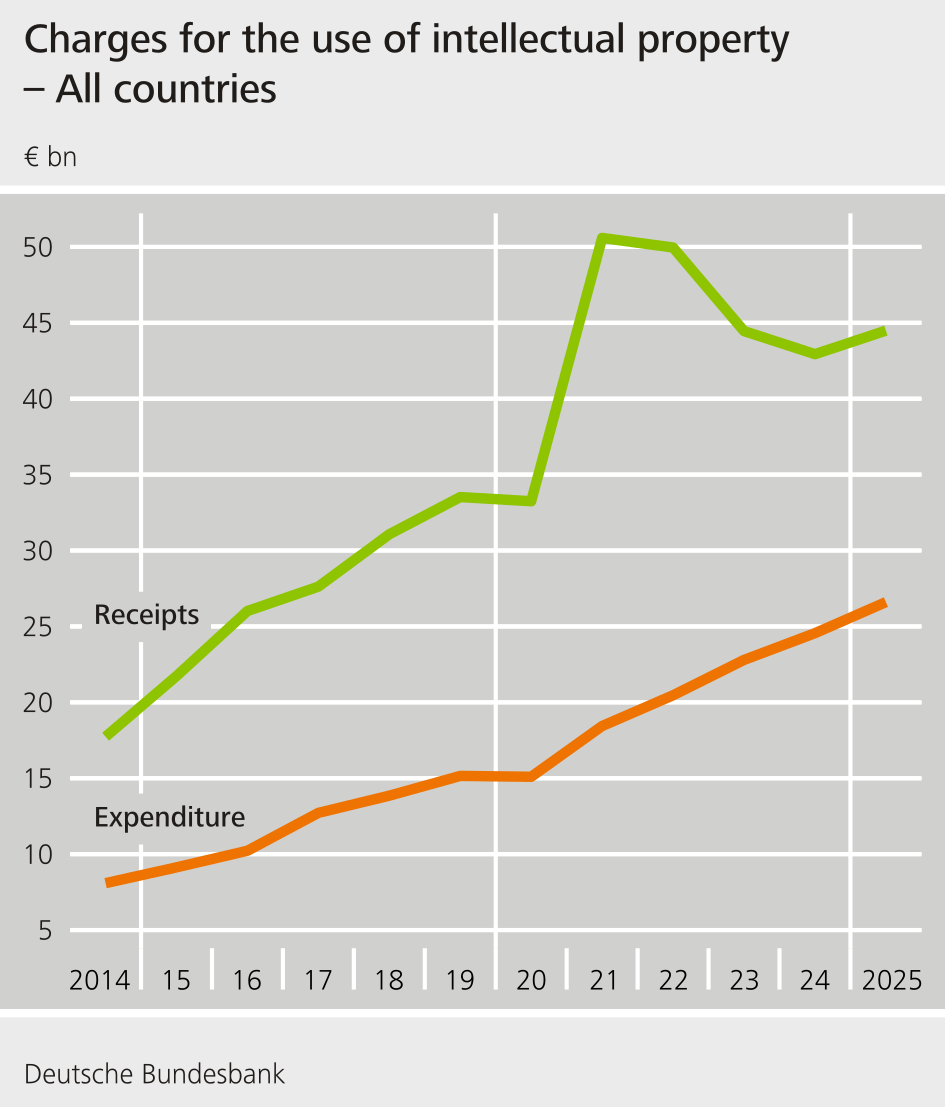
With technological progress, direct transactions for technological services have also become increasingly important. Technological services are defined as "charges for the use of intellectual property", "telecommunications, computer and information services" and "other business-related services". The first two, in particular, are among the most rapidly growing types of services in the past decade.
Using the example of “charges for the use of intellectual property”, expenditure has grown by 229 % since the 2014 reporting year. Over the same period of time, revenue has also experienced growth of 151 %.
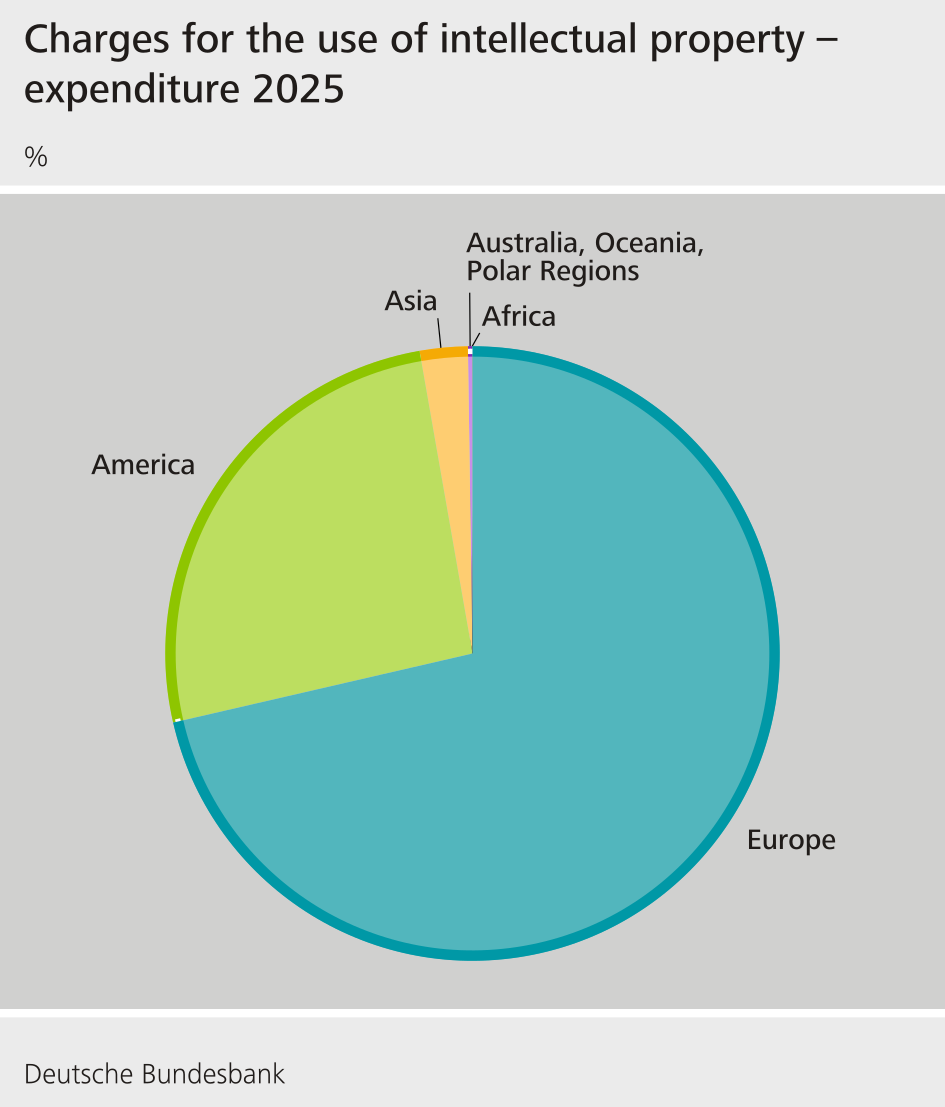
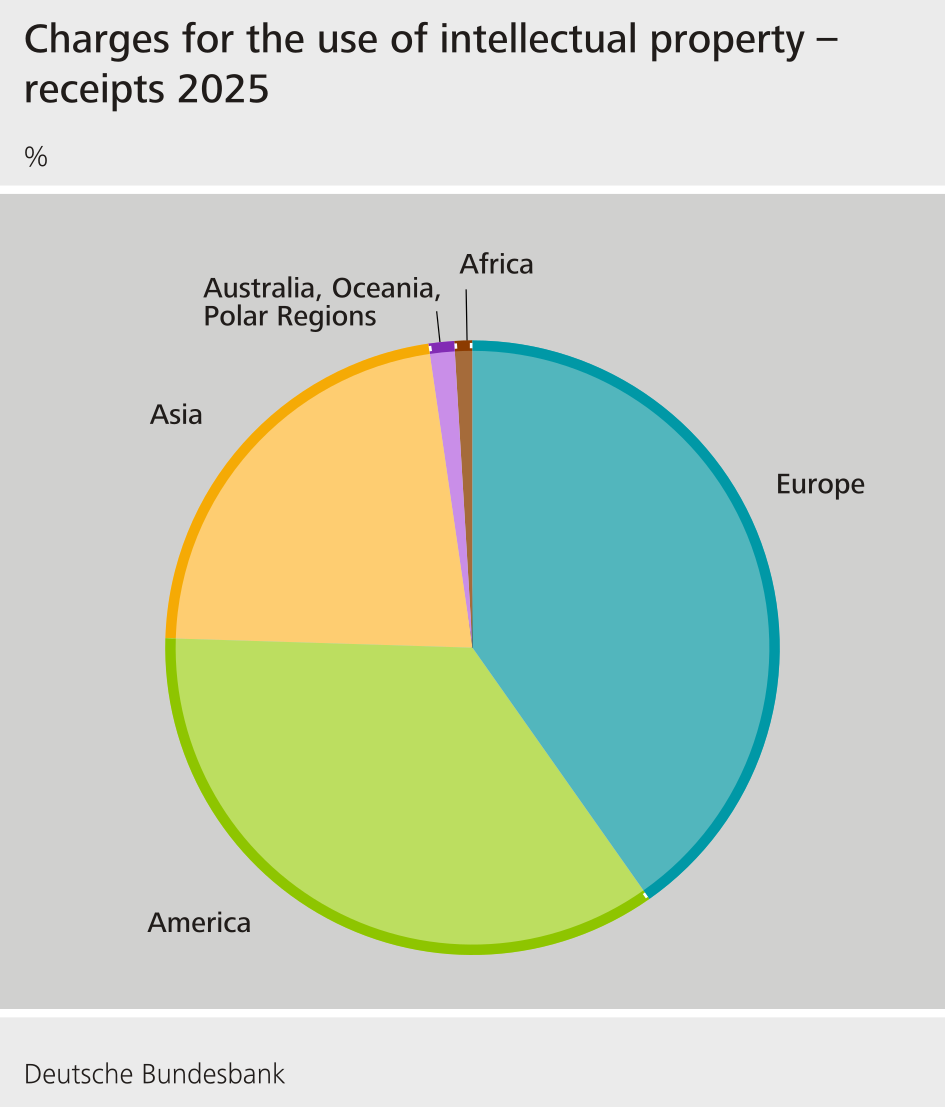
Geographically, the bulk of this expenditure remains in Europe, while America and Asia are second and third. On the receipts side, there is a more homogeneous distribution, but Europe, followed by America and Asia, are still the most important partner regions for this type of service.
Detailed data on technological services vis-à-vis all countries of the world are published in the accompanying table entitled “Technological services in the balance of payments”.